Science & Engineering
If you're a scientist or engineer, or a student in a science/engineering discipline, you'll find TeraPlot a versatile and
reliable tool, more than capable of meeting your professional requirements for plotting software. Often, a single plot type will
meet your needs, but the fact that plot types can be easily combined within a graph gives the flexibility to create
highly tailored visualizations. In addition, the ability to combine tabular and analytical plots within a graph makes it a simple matter
to display experimental data alongside any mathematical model you may have for it. The figures below show a few typical
examples of graphs created using TeraPlot plotting software.
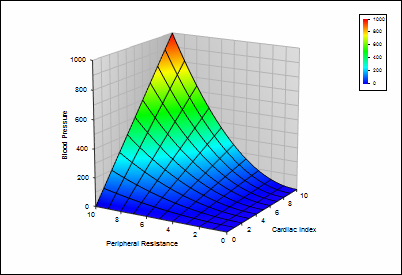
3D model of the relationship between peripheral resistance, cardiac index, and blood pressure. Graph walls are enabled.
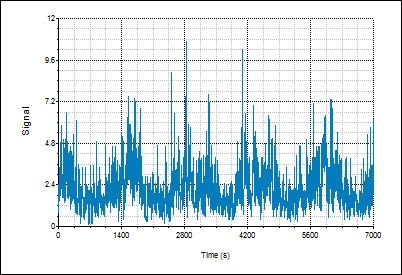
Plot of 7000 input signal points vs time. There is no specific upper limit to the number of points allowed in a 2D plot.
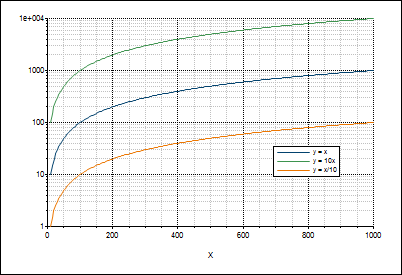
Graph showing log-log plot of the functions y = 10x, y = x and y = x/10 over the x value range 10 - 1000.
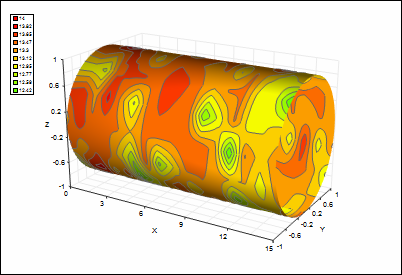
Graph of distortions on the surface of a cylinder. The cylinder itself is shown as perfectly undistorted,
with the colours mapped from a dataset holding the distortion values.
The examples above demonstrate just a few of the features available in TeraPlot plotting software. If you have a particular
graph plotting requirement that you don't see demonstrated here, feel free to contact us at: support@teraplot.com